I. Introduction
The Asian Transport Outlook (ATO) National Database is a collection of national-level indicators on the transport sector in 51 economies in the Asia Pacific region using about 400 indicators. The database also includes relevant information on policy frameworks for transport in these economies. The database is structured into categories and subcategories. The indicators are also tagged with indicator metadata that will enable detailed filtering of the database.
II. Structure of the ATO National Database
A. Categories
To organize data and indicators, nine main categories have been created.
- Infrastructure (INF) describes in quantitative and qualitative manner (a)physical road, rail, waterways-ports, aviation-airport infrastructure that enables transport, (b) ICT Infrastructure, (c) infrastructure to produce different types of fuels used in transport)
- Transport Activity and Services (TAS) describes in quantitative and qualitative manner all forms of transport activity and services through the use of transport infrastructure. This includes description of the vehicles used in transport
- Access & Connectivity (ACC) describes access (physical or digital) provided by different forms of transport and the connectivity characteristics of transport systems at different geographical scales
- Road Safety (RSA) describes all information related to the safety of transport and combines: (a) information on traffic accidents (fatalities and injuries) (b) safety features of transport infrastructure, (c) safety features of vehicles used in transport
- Air Pollution and health (APH) describes all information related to transport related ambient air pollution and non-road safety health related and includes (a) Ambient air quality, (b) vehicle related air pollutant emissions, (c) fuel quality characteristics, (d) general health related information, e.g., activity levels
- Climate Change (CLC) describes all information related to transport related climate change and combines: (a) ambient GHG emissions, (b) vehicle related energy consumption and GHG emissions, (c) climate vulnerability and impacts of transport infrastructure
- Socio-Economic (SEC) describes all information on: (a) socio-economic parameters that drive the development of transport, and (b) specific economic impact of transport and its externalities on society at large.
- Policy (POL) provides an overview of transport-related policies, targets, and instruments, institutional frameworks, and financing of transport, covering all categories of the ATO
- Miscellaneous (MIS) this is a rest category for all other indicators.
B. Subcategories
Each of the nine main categories is subdivided in subcategories specific to the topic.
1. Infrastructure subcategories
- Total Transport Infrastructure (TTI) Information related to quantity and quality of transport infrastructure in a given country without differentiating in geographic level. This can include multiple modes
- Urban Transport Infrastructure (UTI) Information related to quantity and quality of urban transport infrastructure. This can include multiple modes
- Vehicle Manufacture (VMF) Information related to production of different types of vehicles
- ICT infrastructure (ICT) Information related to ICT infrastructure at all levels
- Alternative Fuel Production (AFP) Information related to LPG, CNG, Biofuels, Electricity, Hydrogen
- Conventional Fuel Producing Infrastructure (CFP) Information related to production of gasoline and diesel
2. Transport Activity and Services subcategories
- Passenger Activity Transit (PAT) Describes information on passenger activity within different transit modes at different geographic scales.
- Passenger Activity General (PAG) Describes information on general passenger activity at different geographic scales.
- Freight Activity (FRA) Describes information on Freight activity within different modes at different geographic scales
- Vehicle Parc (VEP) Describes information on vehicles sold, registered in use
- Shared & Innovative Mobility Services (SIM) Describes information related to various types and modes of shared and innovative mobility services
- Transport Activity and Services General (TSG) Rest category
3. Access and Connectivity subcategories
- Rural Access (RAC) Information related to Rural Access including gender and equity related info
- Urban Access (UAC) Information related to Urban Access including gender and equity related info
- National and Regional Connectivity (NRC) Connectivity of national and cross border level transport systems
- Access and Connectivity General (ACG) Rest category
4. Road Safety subcategories
- Road Safety incidents (RSI) Information on accidents, fatalities and serious injuries
- Safety Rating Infrastructure (SRI) Information on safety rating of different types
5. Air Pollution and Health subcategories
- Ambient Air Pollution (AAP) Information on ambient air pollution concentrations, exposure and source apportionment
- Vehicle related Air Pollution (VAP) Information on air quality related vehicle characteristics. Also, total vehicle emissions
- Health Aspects Transport (HAT) Includes other health related information – e.g., time spent on active transport
6. Climate Change subcategories
- Vehicle Related Energy and GHG Emissions (VRE) Describes vehicle related information and total emissions
- Climate Vulnerability Transport (CVT Climate Vulnerability Transport Infrastructure
- Climate Change General (CCG) Rest Category
7. Socio-economic subcategories
- Demographic Variables (DEV) Information related to population in all its facets including urbanizations
- Household Variables (HOV) Information related to household composition, transport related preferences and finances
- Transport investments (TIV) Information related to investments in transport infrastructure as well as its maintenance
- Transport Financial Instruments (TFI) Information related to transport related taxes, subsidies, incentives. This also includes prices of fuel
- Socio Economic General (SEG) Rest category
8. Policy subcategories
- Vision Statements (VIS) Vision statements relating to national development or national transport
- Transport Policies (POL) Information on available national transport policies and transport subsector policies
- Transport Targets (TAR) Information on identified transport-related targets
- Transport Institutions (INS) Information related to institutions in the transport sector
- Policy Instruments (INT) Information related to various policy instruments for Road Safety, Fuel efficiency, etc.
9. Miscellaneous subcategories
- General Rest Category (GRC) Rest category
- COVID (COV) Information related to data gathered and restrictions implemented during the COVID-19 pandemic
- SUM4all (SUM) SUM4all Sustainable Mobility Rating indicators
C. Indicator code
Each indicator has a unique code consisting of three elements: e.g. SEC-TIV-001, SEC refers to the Socio-economic category, TIV refers to the Transport Investments subcategory, and the 001 refers to indicator number within that subcategory. In certain cases when an indicator was scrapped, the number will become vacant. The database is not arranged numerically by indicator code but by subcategory groups.
For the indicators where multiple sources of information are available the indicator code will have an extension consisting of a number (e.g. ACC-RAC-001(1)).
D. Indicator metadata
For each of the indicators a short description is provided in the indicator metadata. In those cases where an indicator has been collected from a secondary source the original source definition will be used. Any applicable notes or limitations are specified in the indicator description as well.
For all the indicators, a set of indicator metadata will be defined that can be used for filtering of the indicators in the interface.
- Scope identifies the geographical coverage of indicator: national, national + international, urban, rural, regional (as in group of countries), or NA
- Mode indicates the mode of transport covered by the indicator: road, rail, shipping/waterways/navigation, aviation, all modes, or NA
- Sector indicates the service sector: passenger, freight, combined, or NA
- Status marks the collection progress of the indicator: pending or complete
E. Indicator source
The sources can broken down in three categories: (a) indicators that have been collected from other secondary sources, (b) indicators composed by the ATO team on the basis of information collection from country sources, these are described as Country Official Statistics and (c) indicators that are calculated by ATO team on the basis of other ATO indicators, these are listed as Calculated/Estimated.
For all indicators, the source is identified in the indicator metadata. If multiple sources of the indicator are available, this is listed accordingly (e.g. for country official statistics, the weblink for each economy is indicated per economy row).
F. Economy metadata
The ATO economies are also tagged with economy metadata. In addition to the indicator metadata, the economy metadata will also help filter down the desired data.
- ADB Subregion is based on ADB Asia-Pacific subregion definition. For Russia and Iran (Islamic Republic of), they are assigned under Others (Central and West Asia, East Asia, Pacific, South Asia, South East Asia, or Others)
- AIIB Subregion is based on AIIB geographical division of AIIB Investment Operations (IO)
- Income Group is based on World Bank income grouping (Low income, Lower middle income, Upper middle income, High income)
- Groups includes various typologies of economies, associations, organizations, and cooperation groupings (Least Developed Countries (LDC), Landlocked Countries (LLC), Small Island Developing States (SIDS), ADB Member, Asia-Pacific Economic Cooperation, Association of South East Asian Nations (ASEAN), Central Asia Regional Economic Cooperation (CAREC), G20, Greater Mekong Subregion (GMS), Organisation for Economic Co-operation and Development (OECD), Pacific Islands Forum (PIF), Regionally Environmentally Sustainable Transport (EST) Forum, Shanghai Cooperation Organisation (SCO), South Asia Subregional Economic Cooperation (SASEC), South Asian Association for Regional Cooperation (SAARC))
G. ATO National Database Masterlist of Indicators
The ATO National Database Masterlist of Indicators provides an overview of the indicators that are included in the ATO National Database. This provides tabular information about the indicators such as indicator definition, scope, mode, sector, source, and status. The masterlist is structured based on the nine categories and corresponding subcategories listed above.
An offline version of the masterlist is available for download in the ATO National Database Masterlist of Indicators page. This includes the indicator description, category, subcategory, scope, mode, sector, status, unit, and source for each indicator however in a tabular form. Using the headers, the list can be filtered down as needed.
III. How to access the ATO National Database
A. Find specific indicators
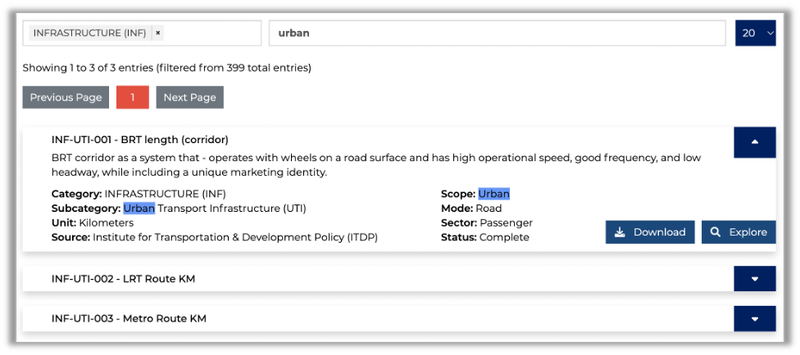
In the web-based version of the ATO National Database Masterlist of Indicators, the masterlist includes a functionality for filtering and searching of indicators to improve ease-of-use. This list of indicators can be filtered by clicking on the category cards, or using the filter box above the list. The searchbox can be used to search for specific indicators. Any keywords entered will be used to look for similar information within the indicator metadata of all the indicators. When the desired indicator is found, the Explore can be clicked to go to the ATO National Database interface where the indicator will already be pre-selected. The Download can be clicked to download the data for all economies and all years for that specific indicator.
B. Create a search
Within the ATO National Database interface, the space on the left will contain panels that filter data by economies, indicators, and time. To access any specific data, all parameters (i.e. economy, indicator, time, and download option) need to have a selection before the Download button becomes active. A prompt will appear if any of the parameters are missing.
1. Economies panel
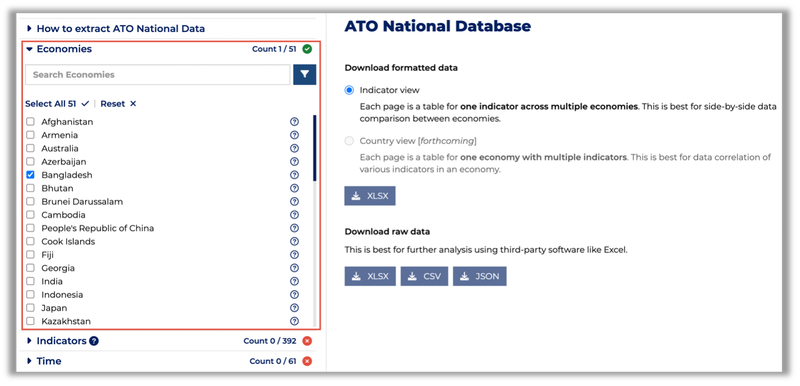
Individual economies can be selected by clicking on the checkbox. All economies can be selected by clicking Select All. The selection can be reset by clicking on Reset.
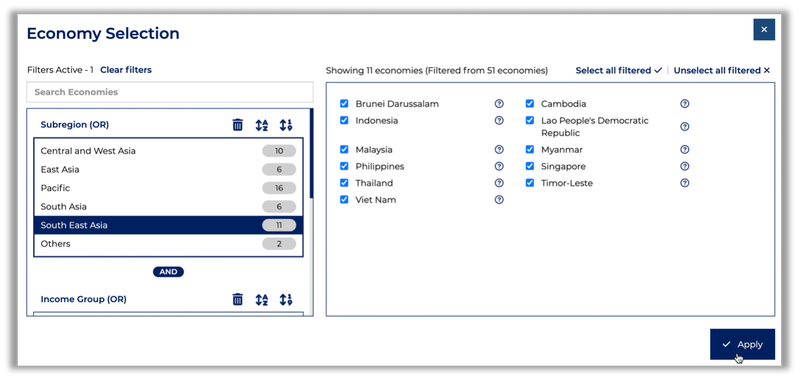
To filter by economy typology, click on the filter button to open the expanded filter window. The filters on the left (i.e. Subregion, Income Group, or other Groups) can be used to narrow down the list of economies.
Notes about filtering:
- Selecting filters within a category will expand the choices (e.g. economies that are either Low income OR Lower-middle income)
- Selecting filters across categories will narrow down the choices (e.g. economies that are both in East Asia AND also High income)
2. Indicators panel
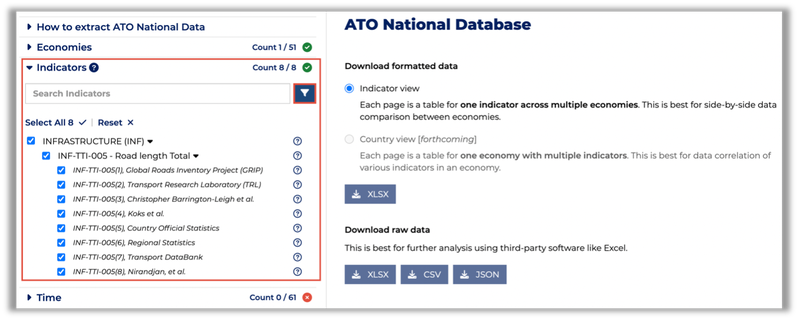
Indicators are organized by nine main categories which can be expanded to show all indicators within each category. Individual indicators can be selected by clicking on the checkbox. All indicators can be selected by clicking Select All. The selection can be reset by clicking on Reset.
When an indicator with multiple sources is selected, all sources are automatically selected.
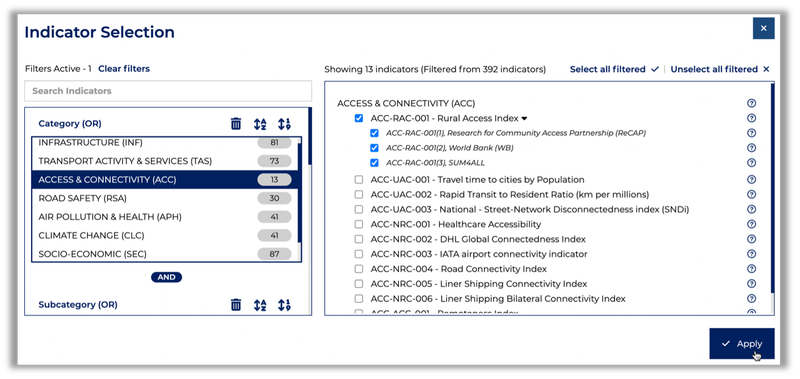
To filter by indicator typology, click on the filter button to open the expanded filter window. The filters on the left (i.e. Category, Subcategory, Scope, Mode, or Sector) can be used to narrow down the list of indicators.
Notes about filtering:
- Selecting filters within a category will expand the choices (e.g. indicators that are either Air Pollution & Health OR Climate Change)
- Selecting filters across categories will narrow down the choices (e.g. indicators that are Infrastructure AND also specifically Urban Transport Infrastructure)
3. Time panel
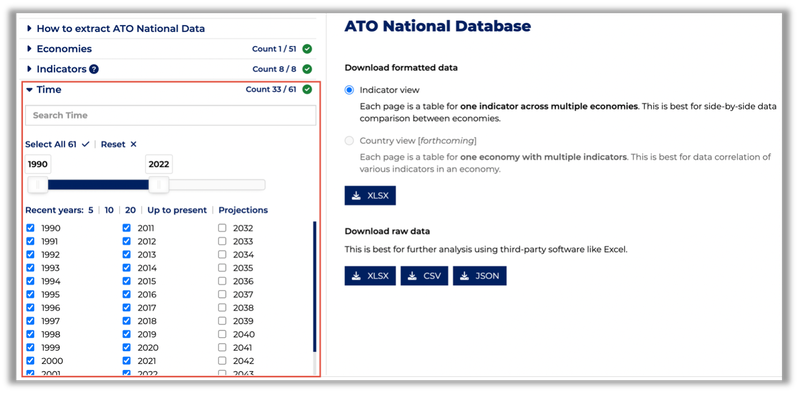
The desired data timeframe can be selected per year by clicking on the checkbox or you can use the slider to select a range of years. All available years can be selected by clicking on Select All. The selection can be reset by clicking on Reset.
Note that if indicators have no data for the selected years, these will not appear in the output generated for download.
Shortcuts are available to quickly select recent 5, 10, or 20 years, years up to present, or projection years.
C. Download selected data
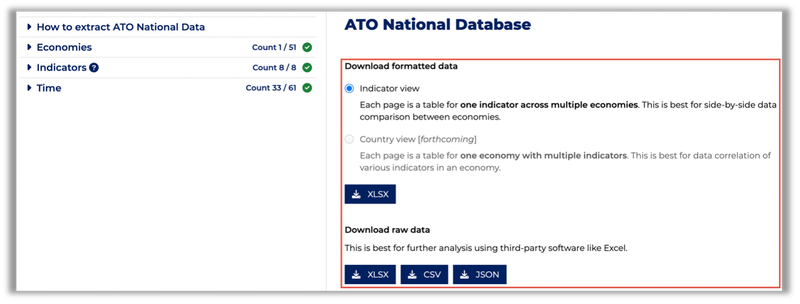
Within the ATO National Database interface, the space on the right will provide selection of the download option for the selected data. After selecting, the appropriate filteypes can be clicked to download the data.
1. Indicator view
The indicator view provides the standard view of indicators. Each page generated is a table for one indicator across multiple economies. This is best for side-by-side data comparison between economies.
When downloaded, the list of selected indicators will be summarized in the Table of Contents (TOC) which includes indicator metadata such as subcategory, indicator name, indicator code, scope, mode, sector, source, and a shortcut to the indicator sheet. Note that indicators which have no data for the selected years will not appear.
The indicator sheet will include the indicator metadata at the top which includes indicator code, indicator name, description, scope, mode, sector, unit, source, and weblink. A shortcut back to TOC is available below the indicator metadata.
The data table will have economies as rows and years as columns. For indicators with multiple units, the respective units will be indicated as columns as well.
2. Country view
The country view provides the factsheet view of economies. Each page generated is an table of one economy across multiple indicators. This is best for an overview of various indicators of one economy.
When downloaded, the list of selected economies will be summarized in the Table of Contents (TOC) which includes ISO Code, ADB Subregion, AIIB Subregion, income group, and a shortcut to the economy sheet.
The economy sheet will include the economy metadata at the top. A shortcut back to TOC is available below the economy metadata.
The data table will have indicators as rows and years as columns. Years starting 2000 will be reflected contiguously until the maximum year selected.
3. Raw data
The raw data provides the long-format view of data. This is best for further analysis using third-party software like Excel. The filetypes that are provided are .xlsx, .csv, and .json.
When .xlsx or .csv is downloaded, each data point will be displayed as a row beside economy code, economy name, indicator code, indicator name, source, units, header, and year. For .json, the data will be displayed in a key:value format.
D. Download Entire ATO workbooks
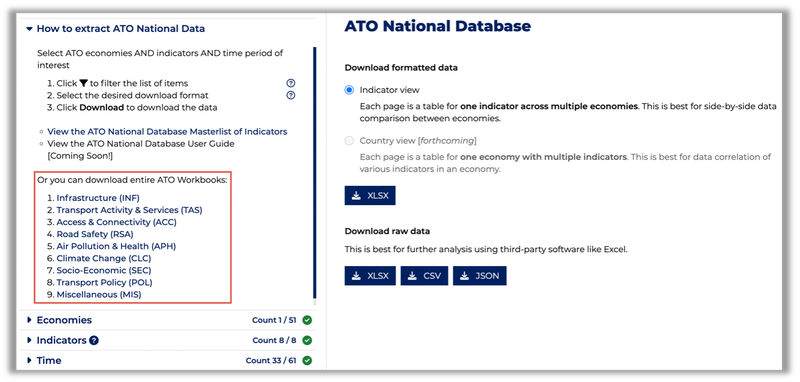
The indicators can also be downloaded by the nine main categories as a whole workbook. Download links are available at the ATO National Database landing page and the ATO National Database interface how-to panel. The structure of downloaded file will follow the standard indicator view.